Plotting 3D data
MATLAB can also plot functions and data in 3D. The following commands are used to plot in 3D:
plot3
surf
mesh
contour
Before you continue, look at the help files for those commands.
The following walkthrough is an example of producing a plot of a 3D function.
Walkthrough
First create a mesh on which to plot the surface
x = linspace(0,20,100);
y = linspace(0,10,100);
[X,Y] = meshgrid(x,y);
Then define a surface by defining a ‘z-value’ for each point on the mesh:
Z=sin(X).*sin(Y);
To view the surface in 3D use the commands:
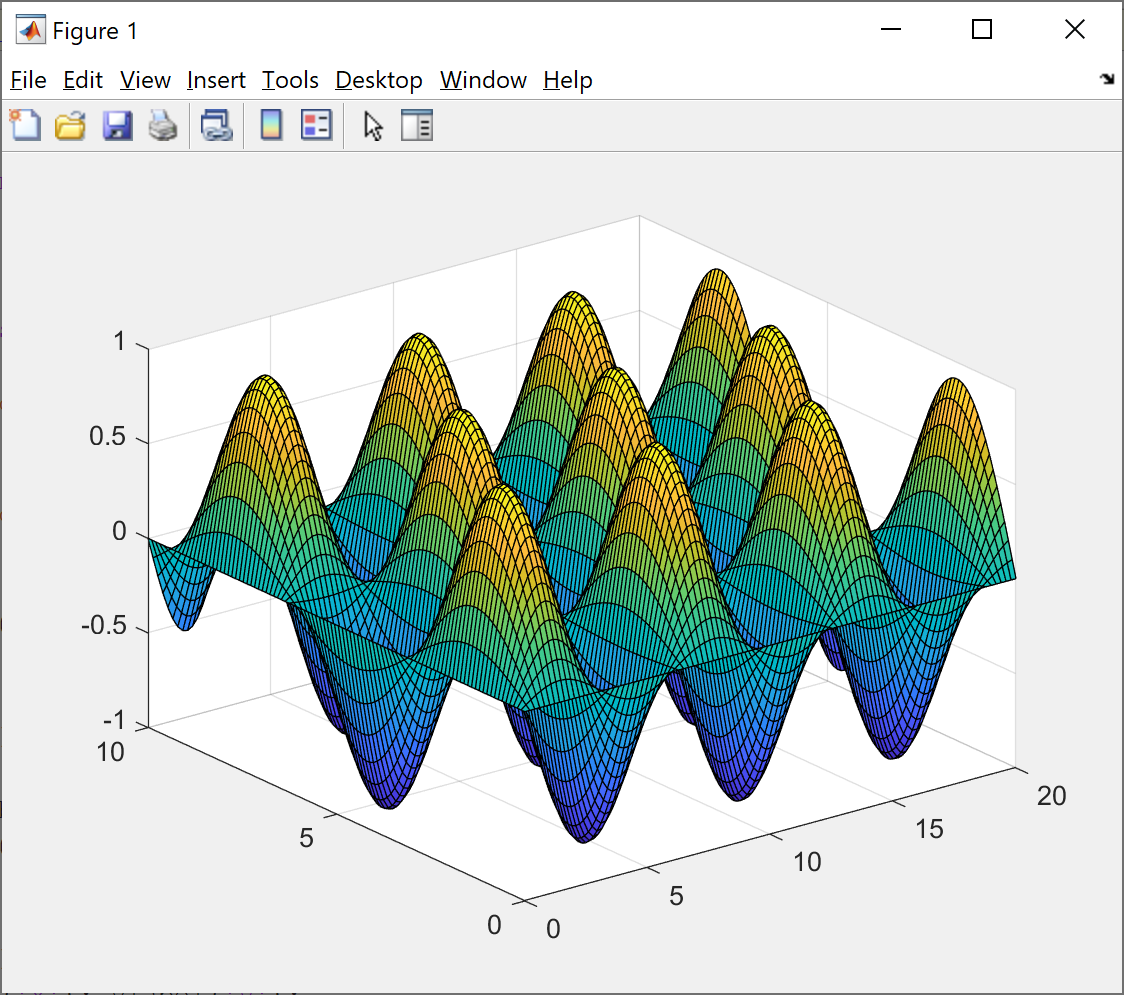
surf(X,Y,Z)
which gives:
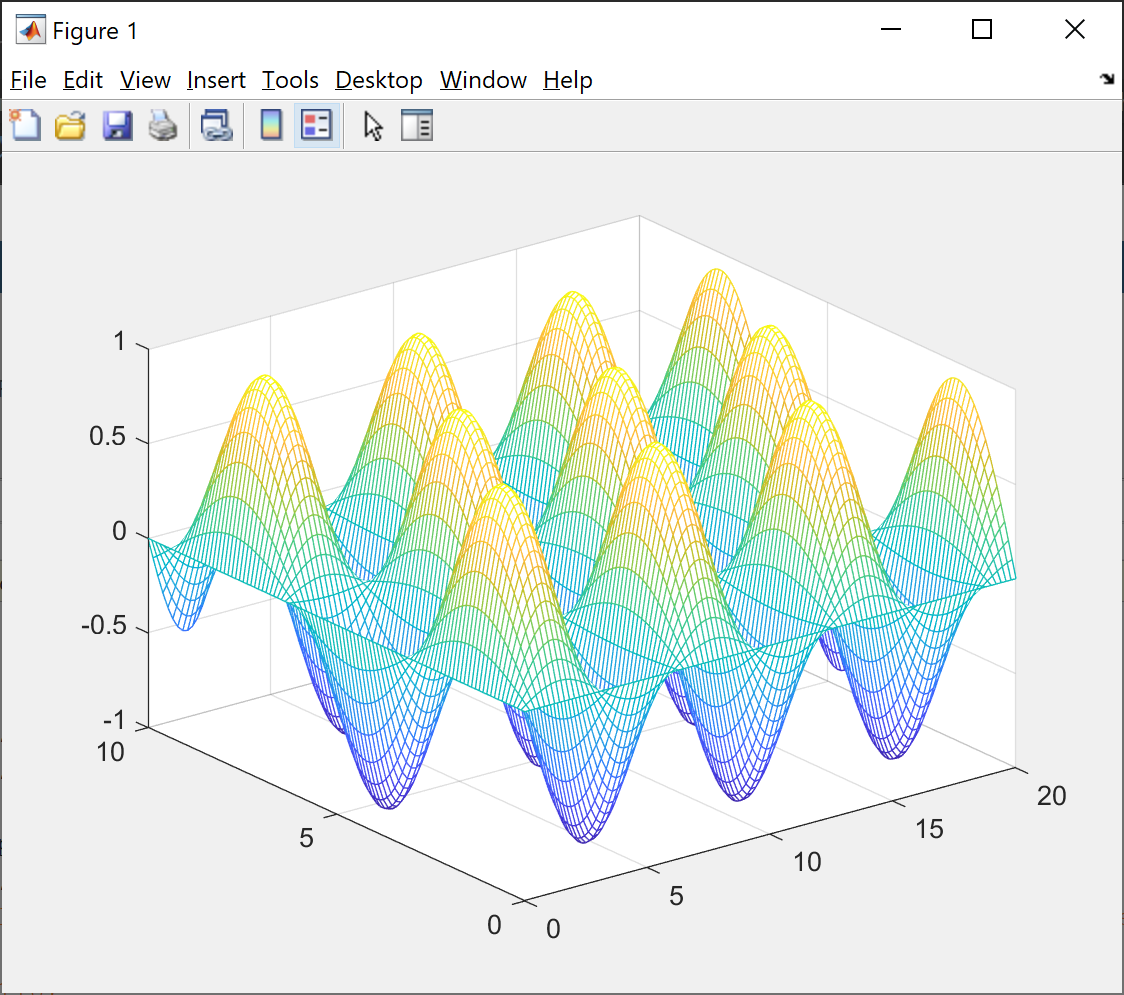
mesh(X,Y,Z)
which gives:
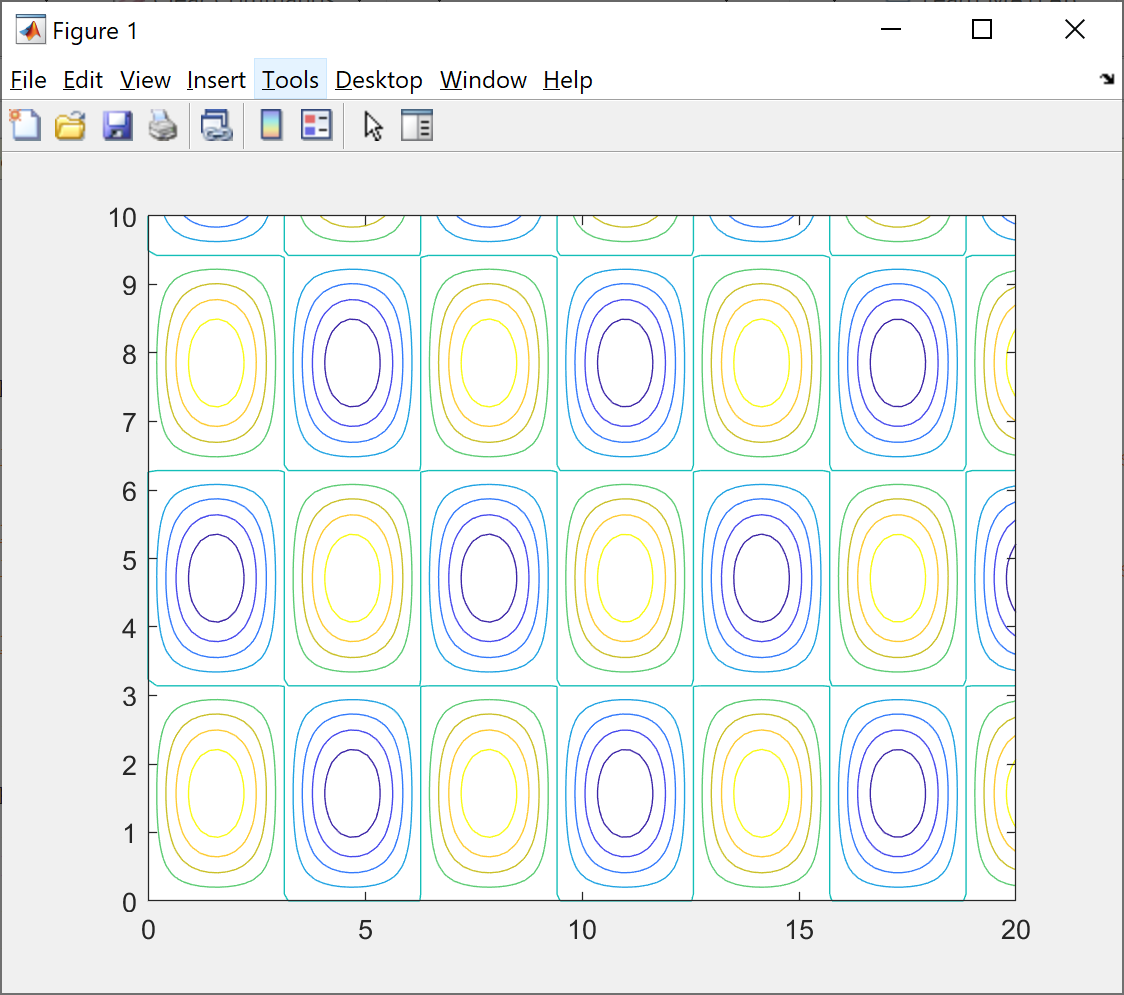
contour(X,Y,Z)
which gives:
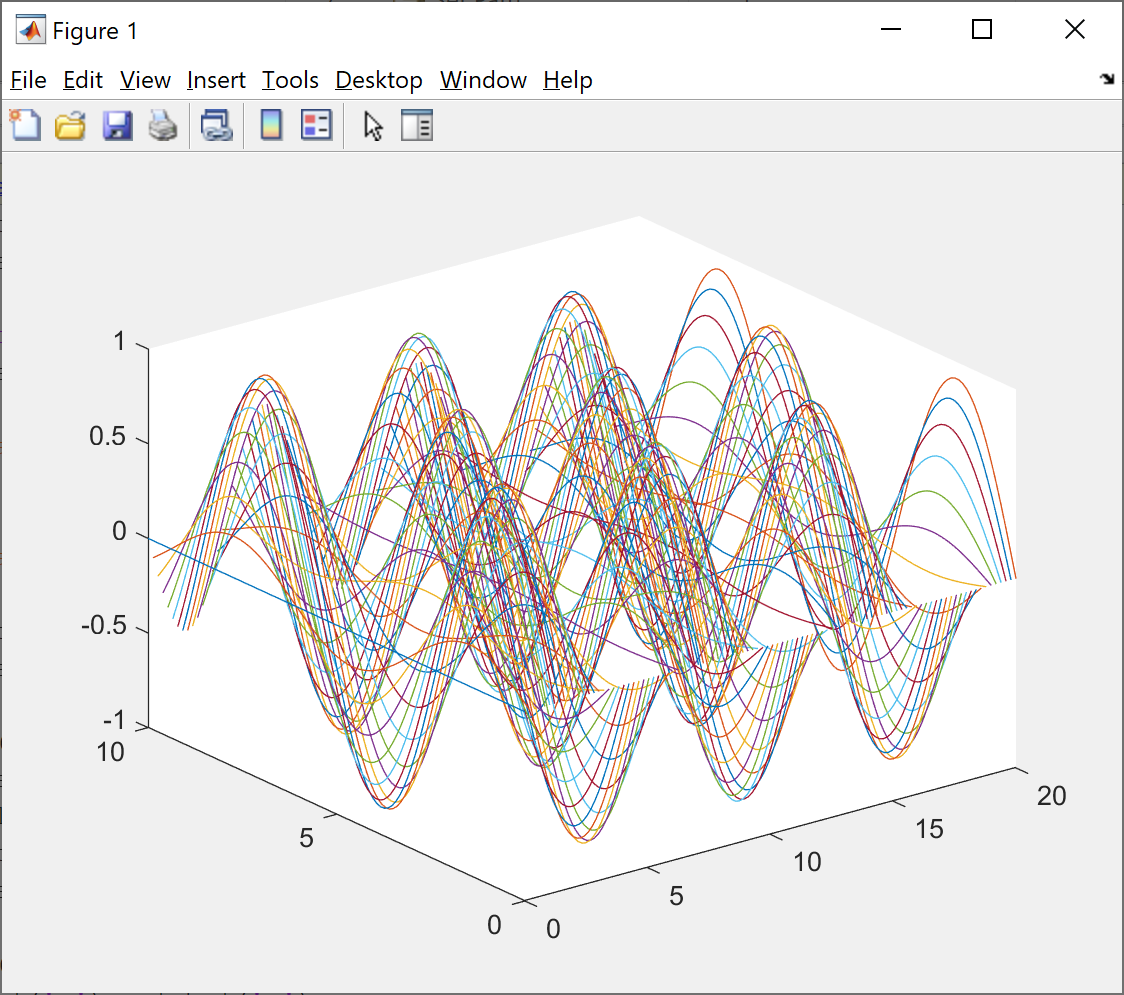
plot3(X,Y,Z)
which gives:
Many of the same tools and commands that worked in 2D plots (legend, title, etc) also work in 3D.
To close all figures at once you can use the close all command.