Exercises
This unit closes with a few simple exercises for you to test the skills you have learned.
-
Download the files Data1.txt and Data2.txt to the current working directory and load them into MATLAB.
-
Using the statistical tools you learned earlier, try to identify what the data could be from.
Expand for hint
Plot a histogram of the two data-sets and calculate their means and standard deviations. You should be able to recognise an underlying probability distribution.
Expand for solution
You can load the files with the command
dataset1 = load('Data1.txt');
dataset2 = load('Data2.txt');
and you can plot the histograms of both datasets using
subplot(1,2,1); hist(dataset1); title('Data1');
subplot(1,2,2); hist(dataset2); title('Data2');
which yields the plots below.
It is clear that the first data-set is from a normal distribution and the mean and standard deviation are found by using
mean(dataset1)
std(dataset1)
mean = 175.3321 and std=10.0953
For the second data-set it is not clear what the distribution is, as there is a relatively low number of data points, but it is still drawn from a normal distribution, whose mean and standard deviation are
mean = 192.0019 and std = 5.2121
The data are simulated height data. The first dataset represents heights of 10,000 men in the UK population, while the second represents the heights of 50 Olympic rowers, so the average height is larger in the second group than in the normal population.
Code which brings all this together is given below.
clear; close all;
%
dataset1 = load('Data1.txt');
dataset2 = load('Data2.txt');
%
% plot the data as histograms
subplot(1,2,1); hist(dataset1); title('Data1');
subplot(1,2,2); hist(dataset2); title('Data2');
%
% calculate the mean and standard deviation of the data
mean(dataset1)
std(dataset1)
mean(dataset2)
std(dataset2)
-
Download the image file TestImage.png to the current working directory and load it into MATLAB.
-
Perform ‘thresholding’ on the image to remove the noise within it. Thresholding is an image analysis technique designed to remove noise from image to pick out its features, in this case by adjusting the intensity to 255 for any pixel in which it is already over 125, and to 0 for any pixel in which it is already below 125.
-
Save the resulting image to file.
Expand for hint
Use imread and imwrite to load and save the image.
Once the image is loaded in, you can treat it like a traditional matrix so you can perform operations such as
find(A>125)
which will give you all the entries of A that are greater than 125, and use this to set them all to 255.
Expand for solution
Code that loads the image and performs the thresholding is given below.
clear; close all;
%
% Load image
TestImage = imread('TestImage.png');
%
% Threshold image as instructed in question
TestImage(TestImage > 125) = 255;
TestImage(TestImage < 125) = 0;
%
% Save thresholded image
imwrite(TestImage,'ThresholdedImage.png');
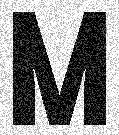
The original image is given first and the thresholded image is below, as you can see the noise is removed.


