GUIs: part 1
If you are developing code for other people to use, then it is much better to provide the user with an interface rather than having to type commands into MATLAB. Moreover, developing a user interface will also make the code more usable for you and make it easier for you to demonstrate your code to other people.
MATLAB has inbuilt functionality that enables you to create GUIs with a few simple commands. The following example will teach you all the basics you need to create a simple GUI, and you will use this to make your own GUI in the later exercises.
Setup of example GUI
In this example we will construct a simple GUI which plots the function $y=\sin(kx)$ for different values of $k$ using a slider to vary the value of the parameter $k$.
The code to create a GUI consists of three parts:
- the figure, which holds the GUI,
- the controls using
uicontrol, and - the plot function, which does the solving and/or plotting.
Setting up the figure
First we make a large figure to contain the GUI
figure('position',[0 0 700 500], 'name','SimpleGUI','NumberTitle','off');
The variables passed to ‘figure’ dictate the properties of the figure:
- The pair
'position',[0 0 700 500]specifies the xy-position of the figure (the first two elements of the vector) in pixels from the bottom-left of your screen, and the width and height of the figure (the last two elements) in pixels. - The pair ‘name’, ‘SimpleGUI’ specifies the title of the figure.
- The pair ‘NumberTitle’, ‘off’ stops the figure being numbered.
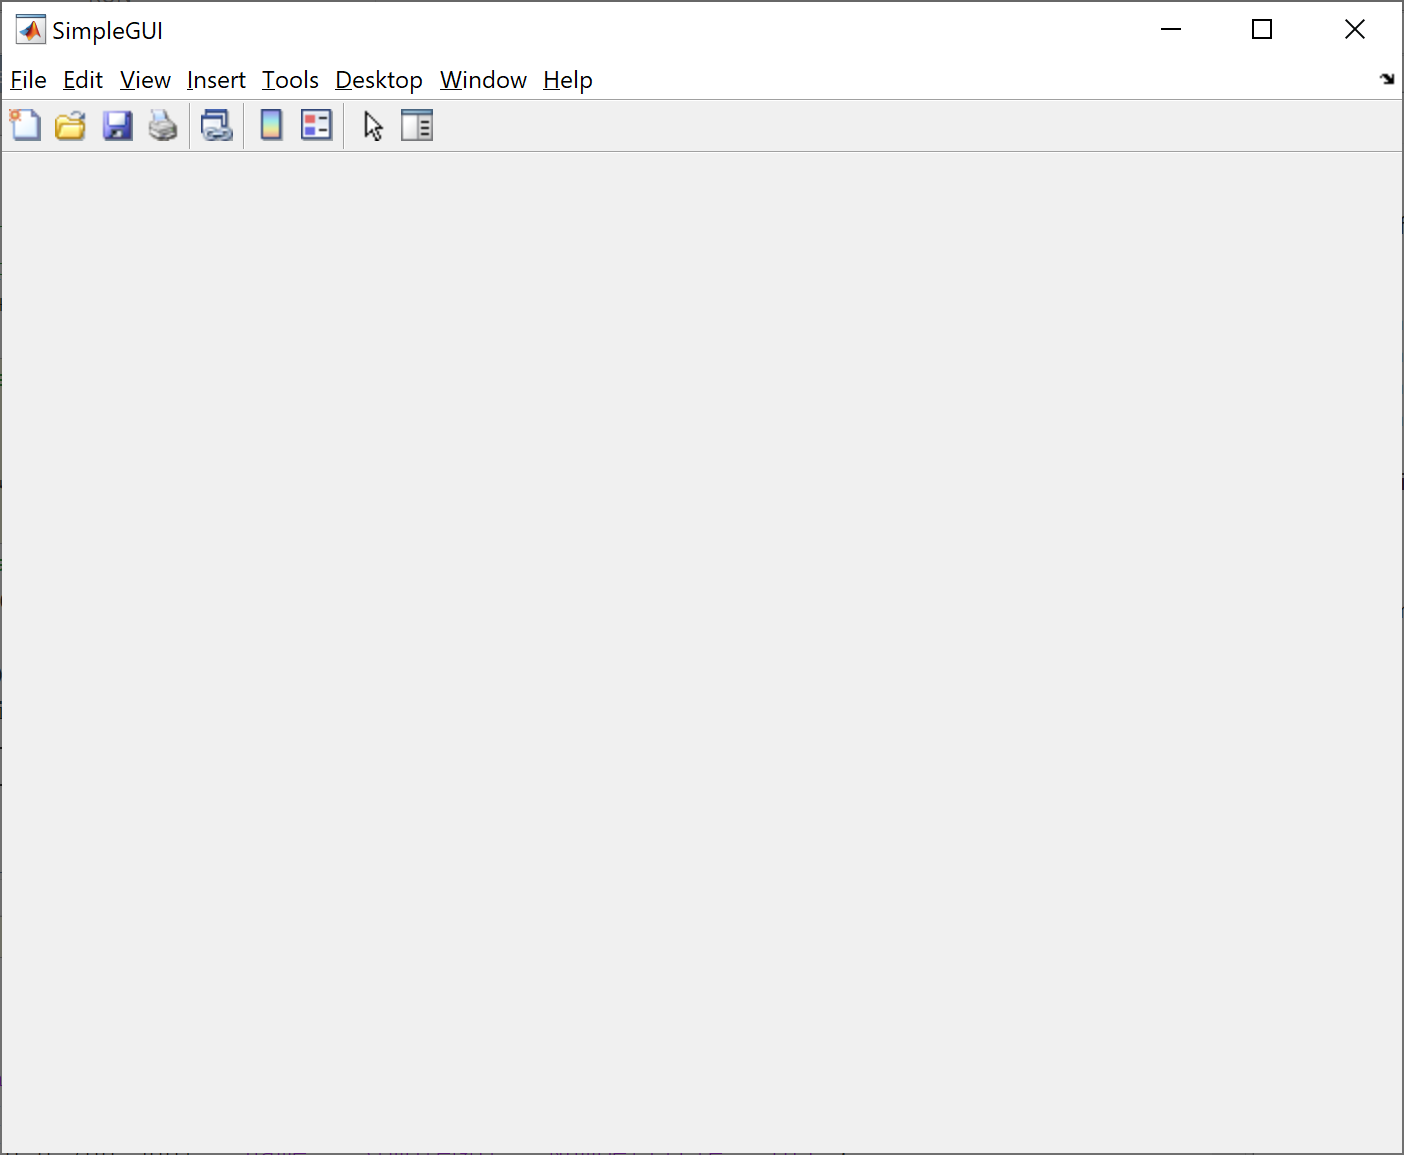
This yields the following figure:
We than make a subplot in this figure to hold the results:
h = subplot('position',[0.1 0.3 0.8 0.6]);
The variables passed to ‘subplot’ dictate the properties of the subplot.
The pair ‘position’,[0.1 0.3 0.8 0.6] specifies the xy-position of the subplot within the figure. The first two elements of the vector represent the position of the bottom left of the subplot from the bottom left of the figure, and the last two elements represent its width and height. All of these values are given as fractions of the total width or height.
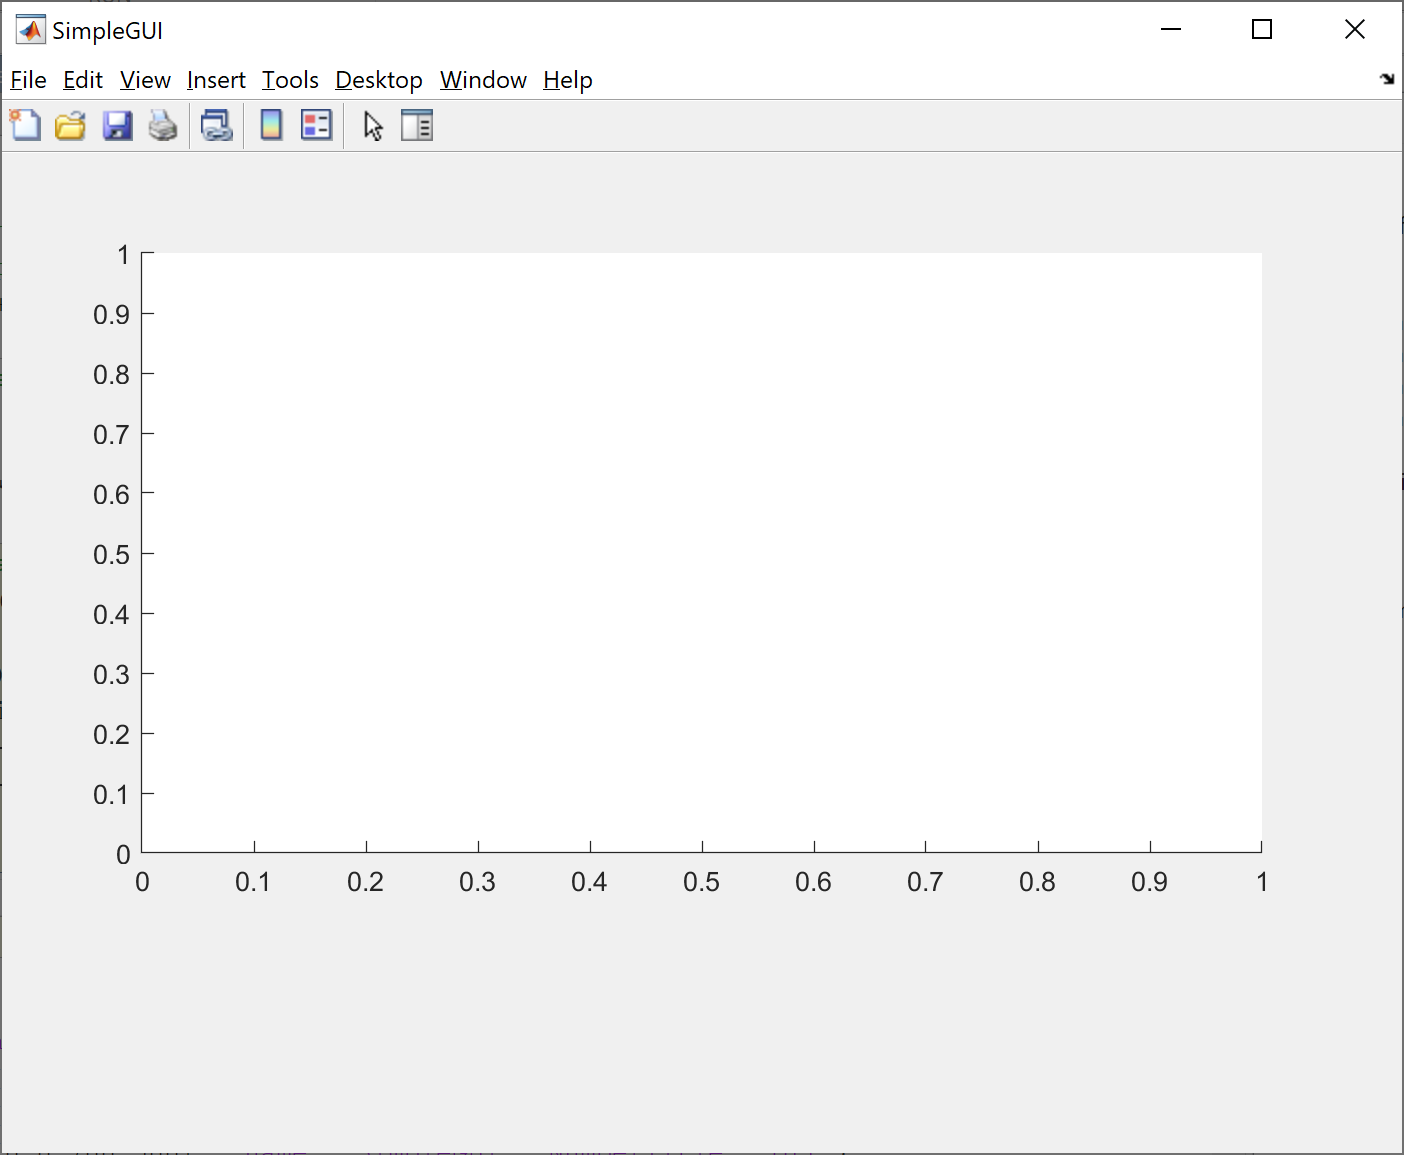
This yields the following figure:
Using uicontrol
Now we have the figure and axes defined, we can add the controls to the GUI.
Elements of the GUI are added using the uicontrol command.
For more details see doc uicontrol.
The uicontrol command can be used to add some descriptive text to the figure:
uicontrol('Style', 'text', 'String', 'Parameter Value', 'Position', [150 50 90 30]);
The variables passed to uicontrol dictate the type of user interface.
- the pair ‘Style’, ‘text’ says we want a textbox.
- the pair ‘String’, ‘Parameter Value’ gives the contents of the textbox.
- the pair ‘Position’, [150 50 90 30] gives the position and size of the text measured in pixels from the bottom left of the figure.
The ‘uicontrol’ command is also used to add a slider to the figure
Slider = uicontrol('Style', 'slider', 'Min', 0, 'Max', 10, 'Position', [250 50 200 30]);
The variables passed to uicontrol dictate the type of user interface.
- the pair ‘Style’, ‘slider’ says we want a slider.
- the pairs ‘Min’, 0 and ‘Max’, 10 give the limits of the slider.
- the pair ‘Position’, [250 50 200 30] gives the position and size of the slider measured in pixels from the bottom left of the figure.
In order to have access to the slider within subfunctions we can define Slider to be a global variable in both the main function and all subfunctions. This is done by including the line:
global Slider;
in all functions in which it is used.
Finally, the ‘uicontrol’ command can be used to add a button to the figure
Button = uicontrol('Style', 'pushbutton', 'String', 'Run', 'Position', [530 50 100 30], 'Callback', @PlotGUI);
The variables passed to uicontrol dictate the type of user interface.
- the pair ‘Style’, ‘pushbutton’ says that we want a button, which executes some code when pressed.
- the pair ‘String’, ‘Run’ give the text displayed on the button.
- the pair ‘Position’, [530 50 100 30] gives the position and size of the button measured in pixels from the bottom left of the figure.
- the pair ‘Callback’, @PlotGUI provide code to run the command ‘PlotGUI’, which can be any function when the button is pressed.
There are more user interfaces defined using uicontrol. See ‘doc uicontrol’ for the full list.
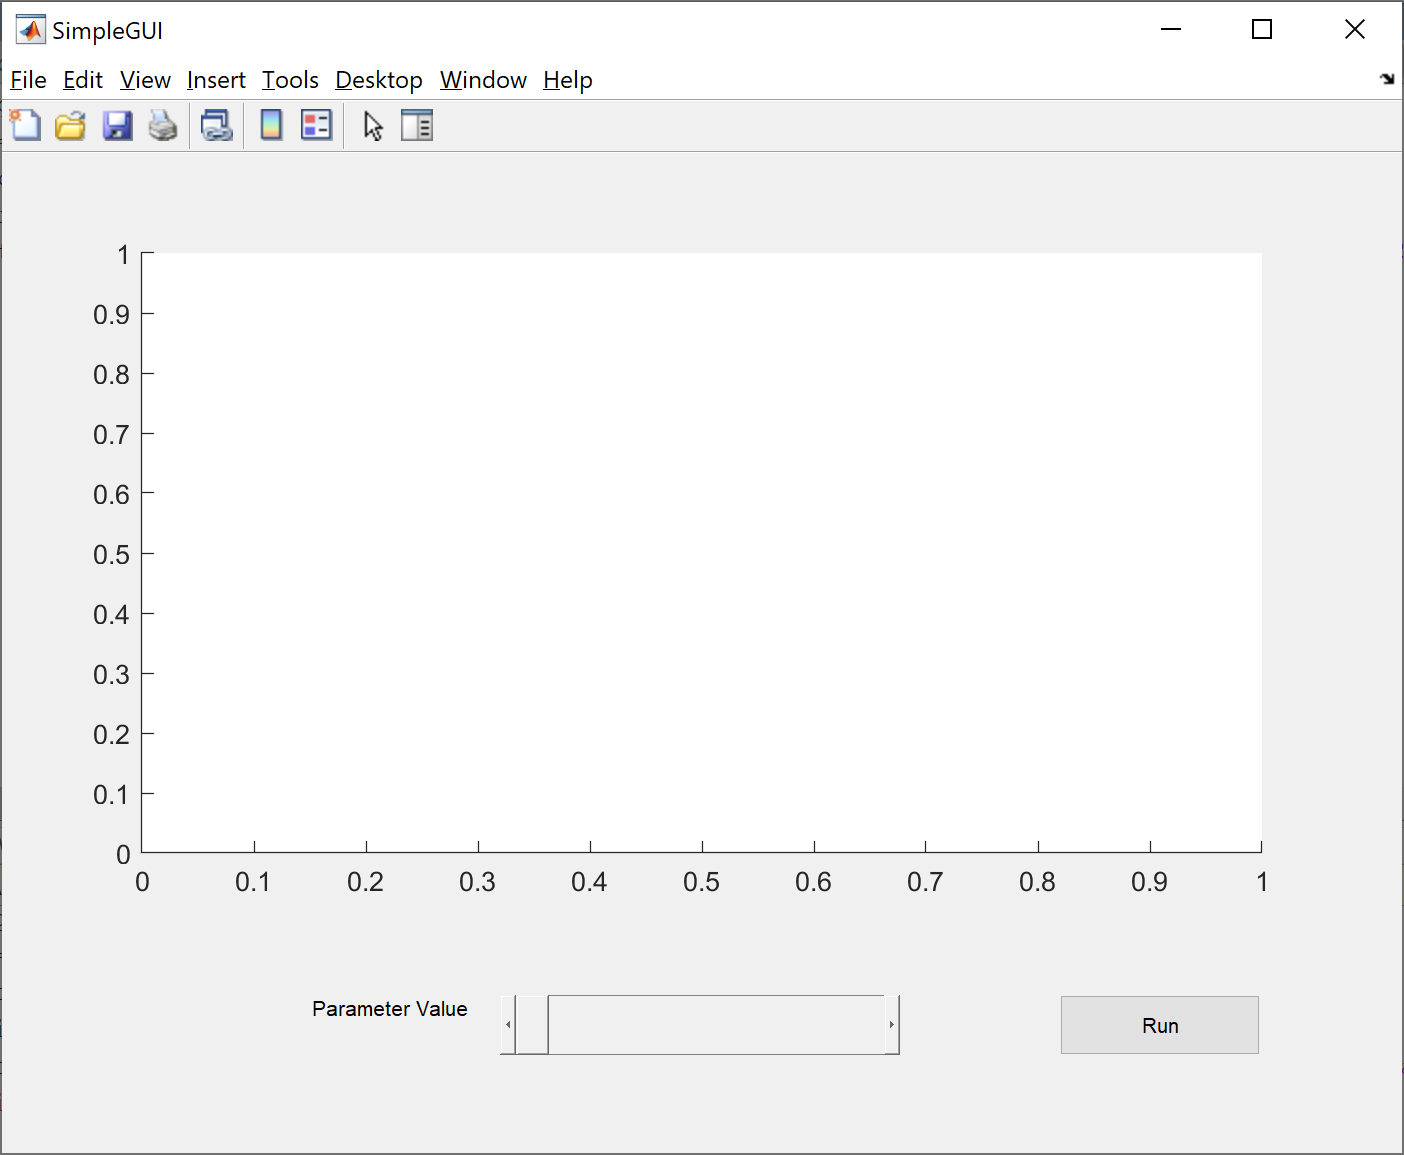
Putting all of this together
figure('position',[0 0 700 500], 'name','SimpleGUI','NumberTitle','off');
h = subplot('position',[0.1 0.3 0.8 0.6]);
uicontrol('Style', 'text', 'String', 'Parameter Value', 'Position', [150 50 90 30]);
Slider = uicontrol('Style', 'slider', 'Min', 0, 'Max', 10, 'Position', [250 50 200 30]);
Button = uicontrol('Style', 'pushbutton', 'String', 'Run', 'Position', [530 50 100 30], 'Callback', @PlotGUI);
gives the following figure: