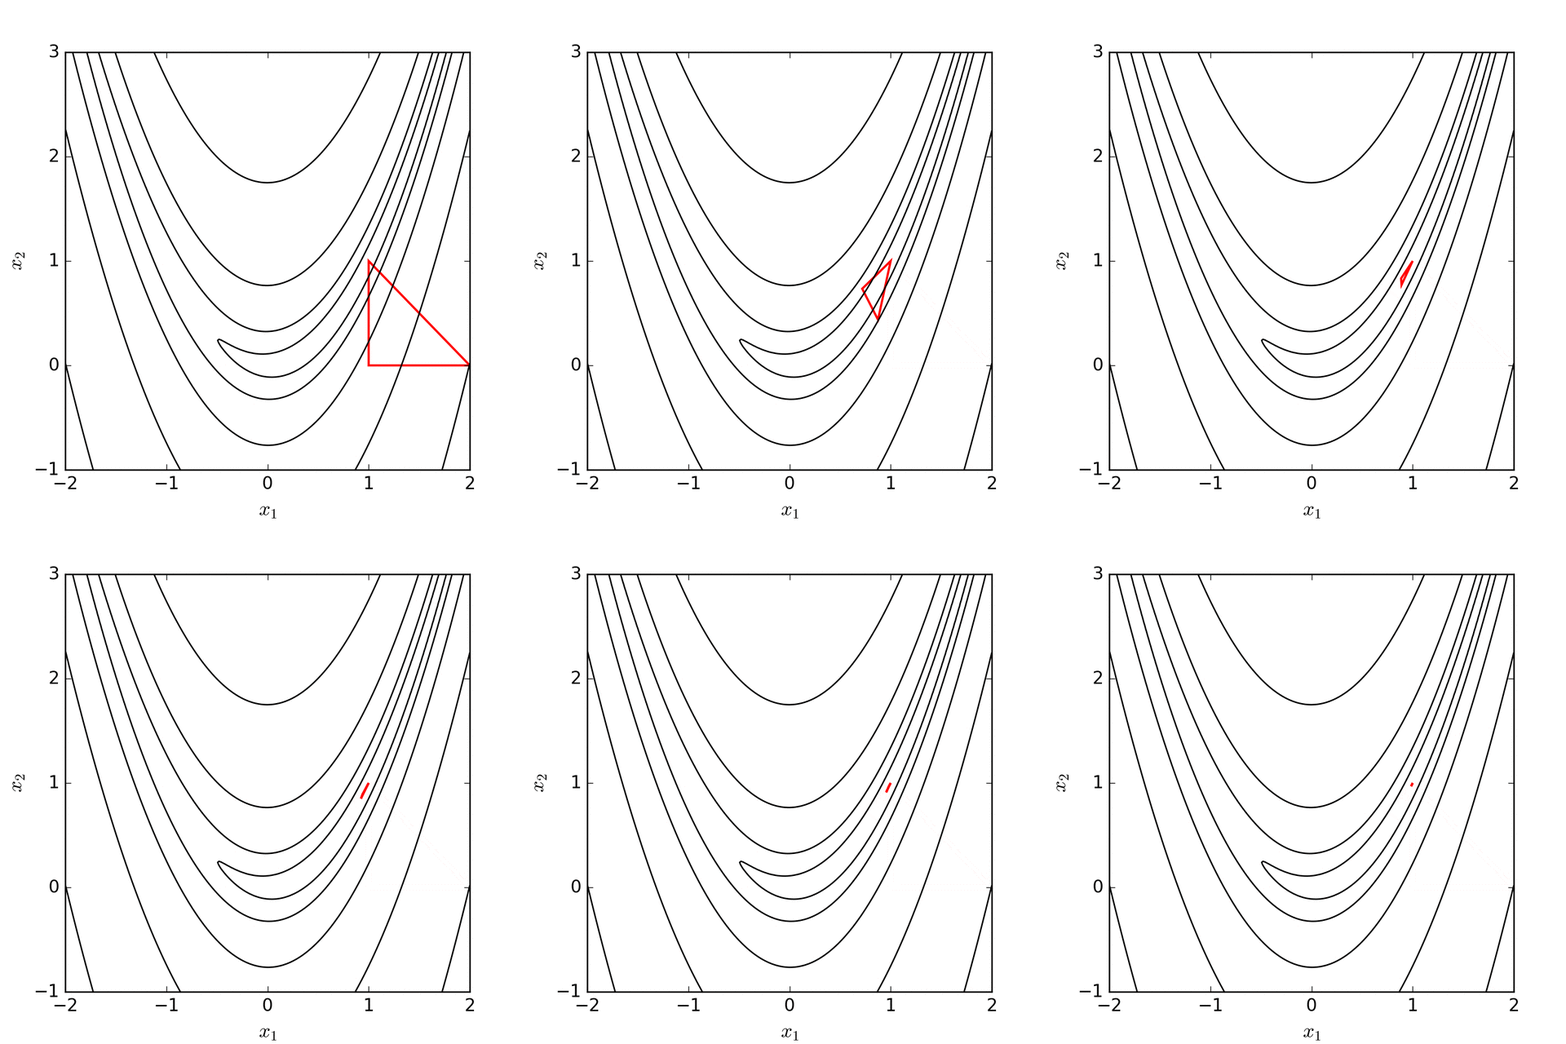
Nelder-Mead method
The Nelder-Mead method is popular and implementations exist in many optimisation software libraries. It is based on the idea of a simplex in parameter space of dimension $n$, which is formed from the convex hull of $n + 1$ points in $\mathcal{R}^n$. These points $x_i$ are ordered according to their function value so that
\[ f(x_1) \le f(x_2) \le \cdots \le f(x_{n+1}) \]
For each iteration of the algorithm, there are five different points of interest, the first of which is the centroid of the $n$ points with the lowest $f$ values
\[ \bar{x} = \frac{1}{n}\sum_{i=1}^n x_i \]
The other four points are defined by considering the line joining $\bar{x}$ and the point with the highest $f$ value $x_{n+1}$
\[ \bar{x}(t) = \bar{x} + t(x_{n+1} - \bar{x}) \]
The four points are the reflection, expanding, the inside contraction and outside contraction points, given by $\bar{x}(-1)$, $\bar{x}(-2)$, $\bar{x}(1/2)$, and $\bar{x}(-1/2)$ respectively.
The Nelder-Mead algorithm tries to replace $x_{n+1}$ by reflecting, expanding, or contracting the simplex to one of these points. If it cannot find a better point, then all the vertices on the simplex are shrunk towards the best vertex $x_1$.

Algorithm
Scholarpedia and Wikipedia provide diagrams and pseudocode of the Nelder-Mead algorithm, as does Chapter 9.5 of the Nocedal and Write textbook given below
Initialisation and termination
It is not obvious how Nelder-Mead should be initialised, given a single starting point $x_0$ by the user. The (Gau 2012) paper provides an initialisation routine that was also used in MATLAB's fminsearch function. The $x_0$ point is used as one of the vertices, with the remaining $n$ vertices set to $x_0 + \tau_i e_i$, where $e_i$ is a unit vector in the $i^{th}$ coordinate and
\[ \tau_i = \begin{cases} 0.05 \text{ if }(x_0)_i \ne 0,\\ 0.00025 \text{ if }(x_0)_i = 0,\\ \end{cases} \]
For termination, Nelder and Mead recommended stopping the iteration when the standard deviation of the function evaluations reduces below a certain tolerance. MATLAB's fminsearch terminates when $\max_{2 \le i \le n+1} |f_i - f_1| \le \text{TolFun}$ and $\max_{2 \le i \le n+1} || x_i - x_1 ||_\infty \le \text{TolX}$, or if the maximum number of iterations of function evaluations is reached.
Other Reading
- Nelder, John A.; R. Mead (1965). "A simplex method for function minimization". Computer Journal. 7 (4): 308–313. doi:10.1093/comjnl/7.4.308.
- Gao, F., & Han, L. (2012). Implementing the Nelder-Mead simplex algorithm with adaptive parameters. Computational Optimization and Applications, 51(1), 259-277.
- Numerical optimization by Nocedal, Jorge; Wright, Stephen J., 1960-, Chapter 9
Problems
Code up the Nelder-Mead algorithm and compare its performance against the steepest descent, Newton and dogleg algorithms you did in the last lesson. You can evaluate them on the 2D quadratic function $f(x, y) = x^2 + y^2$, the 2D Rosenbrock function or on one of many different optimisation test functions
Expand for solution
import numpy as np
import matplotlib.pyplot as plt
from scipy.optimize import minimize, shgo
import matplotlib.animation as animation


def convex_function(x):
    return np.sum(np.array(x)**2, axis=0)


def order_vertices(f, vertices):
    N = vertices.shape[0]
    f_evals = np.array([f(vertices[i]) for i in range(N)])
    ind = np.argsort(f_evals)
    return vertices[ind], f_evals[ind]


def nm_line(t, centroid, worst):
    return centroid + t * (worst - centroid)


def centroid(vertices):
    x = vertices[0]
    for i in range(1, vertices.shape[0]-1):
        x += vertices[i]
    return x/(vertices.shape[0]-1)


def nelder_mead(f, x0, tol=1e-5, max_iter=1000):
    n = len(x0)

    # MATLAB fminsearch initialisation routine
    vertices = np.empty([n+1, n], dtype=x0.dtype)
    vertices[0, :] = x0
    for i in range(1, n+1):
        vertices[i, :] = x0
        if x0[i-1] == 0:
            vertices[i, i-1] += 0.00025
        else:
            vertices[i, i-1] += 0.05

    saved_vertices = np.empty([n+1, n, max_iter], dtype=x0.dtype)
    # Nelder–Mead algorithm from:
    #    Numerical optimization
    #    by Nocedal, Jorge; Wright, Stephen J., 1960-,
    #    Chapter 9
    for step in range(max_iter):
        vertices, f_evals = order_vertices(f, vertices)
        saved_vertices[:, :, step] = vertices
        if np.std(f_evals) < tol:
            break
        cent = centroid(vertices)
        reflect = nm_line(-1, cent, vertices[-1])
        f_reflect = f(reflect)
        if f_evals[0] <= f_reflect and f_reflect < f_evals[-2]:
            vertices[-1] = reflect
        elif f_reflect < f_evals[0]:
            expansion = nm_line(-2, cent, vertices[-1])
            f_expansion = f(expansion)
            if f_expansion < f_reflect:
                vertices[-1] = expansion
            else:
                vertices[-1] = reflect
        elif f_reflect >= f_evals[-2]:
            contraction_successful = False
            if f_evals[-2] <= f_reflect and f_reflect < f_evals[-1]:
                out_contract = nm_line(-0.5, cent, vertices[-1])
                f_out_contract = f(out_contract)
                if f_out_contract <= f_reflect:
                    vertices[-1] = out_contract
                    contraction_successful = True
            else:
                in_contract = nm_line(0.5, cent, vertices[-1])
                f_in_contract = f(in_contract)
                if f_in_contract <= f_reflect:
                    vertices[-1] = in_contract
                    contraction_successful = True
            if not contraction_successful:
                for i in range(1, n+1):
                    vertices[i] = 0.5*(vertices[0] + vertices[i])
    return saved_vertices[:, :, 0:step+1]


if __name__ == '__main__':
    for f in [convex_function]:
        x0 = np.array([1.0, 1.0])
        x_min = np.array([-1.0, -1.0])
        x_max = np.array([1.0, 1.0])

        saved_vertices = nelder_mead(f, x0)
        print('Complete after', saved_vertices.shape[2], 'iterations')

        nx, ny = (100, 100)
        x = np.linspace(x_min[0], x_max[0], nx)
        y = np.linspace(x_min[1], x_max[1], ny)
        xv, yv = np.meshgrid(x, y)
        eval_f = f([xv, yv])
        fig, ax = plt.subplots()
        c = plt.contourf(x, y, eval_f)

        ln, = plt.plot(
            np.append(
                saved_vertices[:, 0, 0],
                saved_vertices[0, 0, 0]
            ),
            np.append(
                saved_vertices[:, 1, 0],
                saved_vertices[0, 1, 0]
            )
        )

        def init():
            ax.set_xlim(x_min[0], x_max[0])
            ax.set_ylim(x_min[1], x_max[1])
            return ln,

        def update(i):
            ln.set_data(
                np.append(
                    saved_vertices[:, 0, i],
                    saved_vertices[0, 0, i]
                ),
                np.append(
                    saved_vertices[:, 1, i],
                    saved_vertices[0, 1, i]
                )
            )
            return ln,

        ani = animation.FuncAnimation(
            fig, update,
            range(1, saved_vertices.shape[2]),
            init_func=init, blit=True
        )
        plt.show()